A Gamble on This Stock Has Only Led to Losses...
The drop from the price peak of $51 in mid-2023 to the present $32 represents a loss of 37% for those who made purchases in mid-July 2023 and have held on.


MGM Resorts International (MGM), the name-brand casino/resort company hit a new 52-week low in early Friday trading and then managed to close with a 1.23% gain for the day.
It wasn’t just MGM Resorts International – a similar stock in the sector, Caesars Entertainment (CZR) also closed with a new low. It may be that recent economic policies announced in Washington, D. C. make it less likely that gambling activities will be as profitable.
Here’s how the daily price chart for MGM Resorts looks.
The price that dropped below $31 on Friday morning broke below the previous support level established with a January 2025 low.
Daily price chart
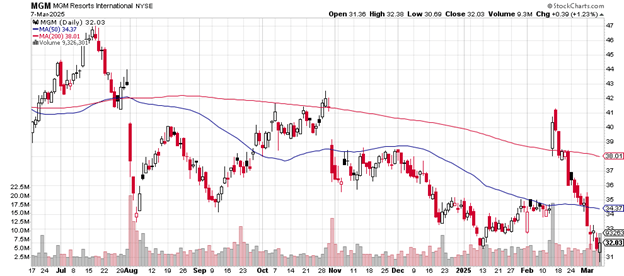
The session volume of 9.36 million shares traded exceeded the stock’s average daily volume of 4.77 million, an indication of greater than usual investor interest.
MGM Resorts International peaked in July 2024 at $47. Friday’s slide to the $32 closing price is a 31.9% loss in value for those who bought at the top.
The 50-day moving average crossed below the 200-day moving average at the beginning of August as that three-day gap lower progressed.
The stock traded above the 200-day briefly in late October 2024 and again in mid-February 2025 but could not maintain that status.
It now trades below the two closely followed moving averages, both of which stubbornly remain in downtrend mode.
Here’s the weekly price chart
Weekly price chart
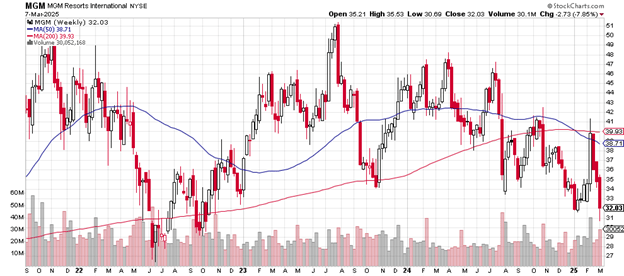
The 50-week moving average crossed below the 200-week moving average in early January 2025, not a hopeful sign for MGM Resorts stock.
You can see on the price chart this is the first time the 50-day has traded below the 200-day for the three-plus years shown.
The drop from the price peak of $51 in mid-2023 to the present $32 represents a loss of 37% for those who made purchases in mid-July 2023 and have held on.
The long-term support level might be the June 2022 low of just below $27 where buyers overcame sellers and established support.
MGM Resorts International has a market cap of $9.15 billion. It’s an S&P 500 component with a price-earnings ratio of 13.40. The debt-to-equity ratio is up there at 10.54.
A short float of 7.32% indicates a greater than usual interest from Wall Street money managers who specialize in short selling. Should a significant rally develop at some point, short covering could be enough to fuel it.
Argus Research on February 14th, 2025 upgraded its opinion of the stock from “hold” to “buy” with a price target of $50.
MGM Resorts International does not pay a dividend.
Charting the markets!
John Navin
Analyst, The Flash Report
Stats courtesy of FinViz.com. Charts courtesy of Stockcharts.com.
Not investment advice. For educational purposes only.