Amazon's Big "Loss" Drags Down Market
Amazon (AMZN) stock has a big effect on the major indexes. That’s because the company is one of the 30 Dow Jones Industrials, a component of the S&P 500, and also a member of the Nasdaq 100.


Friday’s 2.83% loss in Amazon (AMZN) stock has a big effect on the major indexes.
That’s because the company is one of the 30 Dow Jones Industrials, a component of the S&P 500, and also a member of the Nasdaq 100.
When Amazon drops, all the major stock market major gauges drop. The Jeff Bezos-founded online retail operation has a market cap of $2.3 trillion.
After hitting a new high in early February of just above $240, the price began a nosedive that’s taken it down to near $216 and it’s not even the end of the month.
Here’s the daily price chart.
Daily price chart
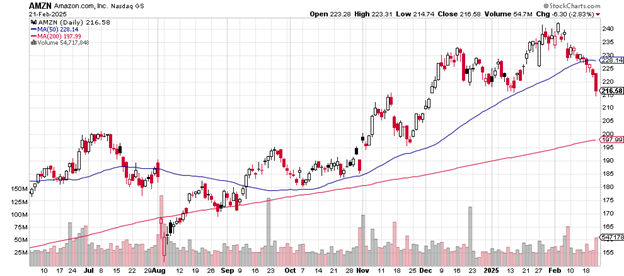
Amazon has now had four closes below the 50-day moving average which looks as if it might be about to trend downward again.
The price on Friday dropped briefly below the previous support level of $215, the level of the January low. Although it recovered from that by the end of the session, it’s a bearish kind of price chart pattern, near term.
The confirming signal for that is the expansion of volume: 55,097,802 shares traded compared to average daily volume of 35.58 million.
The next area of support would be the November low of near $195 which also happens to fall in the general zone of the 200-day moving average.
It’s been a powerful uptrend from the early 2023 low near $80 up to the early 2025 high of $240. The 50-week moving average crossed above the 200-week moving average in early April 2024 and has remained above it since then.
The weekly price chart is here.
Weekly price chart
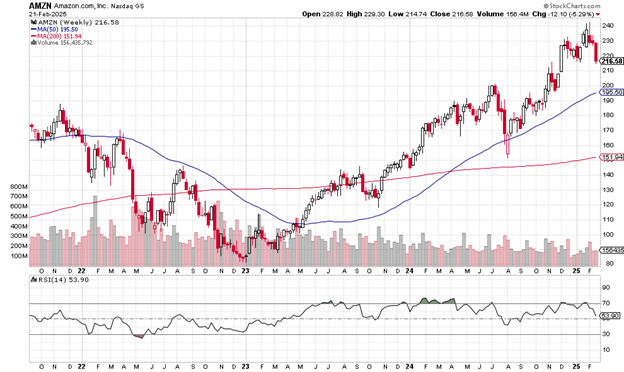
The early October 2024 low of $180 is a likely support area if a serious amount of selling unfolds. Under that is the August 2024 low near $150 where buyers overcame sellers again.
Now that the earlier 2025 low has been taken out on volume, it may be more difficult for Amazon to conquer the $240 resistance level if buyers take it up that way again.
The stock trades with a price-earnings ratio of 39.22, about the same as the p/e for the S&P 500 as a whole. From that standpoint, it could not be said that Amazon is overvalued in the way that a few other big tech names are.
This year’s earnings are up by 14.77% and up over the past five years by 36.89%.
The short float of .75% is a low level, suggesting a lack of interest among Wall Street money managers in shorting the stock.
Amazon does not pay a dividend.
Charting the markets!
John Navin
Analyst, The Flash Report
Stats courtesy of FinViz.com. Charts courtesy of Stockcharts.com.
Not investment advice. For educational purposes only.