America’s Favorite RV is Not it’s Favorite Stock
The name-brand recreational vehicle maker fails to join the new highs of the S&P 500 and the Nasdaq 100. Both of which climbed to new highs during the session.


Wednesday’s drop of 3.50% took Winnebago Industries (WGO) down to a new 52-week low.
The name-brand recreational vehicle maker fails to join the new highs of the S&P 500 and the Nasdaq 100. Both of which climbed to new highs during the session.
It’s just the opposite for Winnebago Industries, which has been showing an increasingly down-trending price chart pattern.
With a market cap of $1.22 billion, the stock is a member of the Russell 2000 small-cap ETF.
Here’s how the daily price chart looks.
The 50-day moving average has traded underneath the 200-day moving average since June 2024. That’s a long time, especially considering how much better the big-name tech and social media stocks have traded over the same period.
Daily price chart
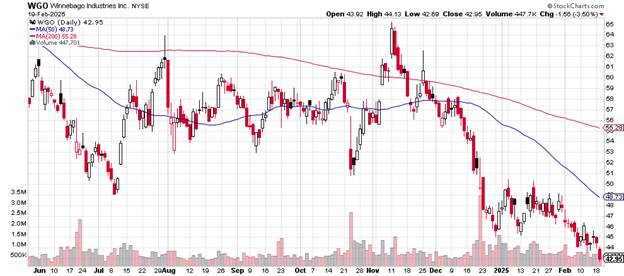
A money manager with this name in the portfolio would likely be underperforming peers who did not own it, not a good circumstance.
Winnebago in December 2024 dropped to below the previous support level from July 2024 and then bounced somewhat into January 2025, but not enough to overcome the number of sell orders.
The slide from the early November 2024 high of $65 to the most recent price of $42.95 is a 33.8% loss for investors who bought at the top and continue to hold.
Here’s the weekly price chart.
The 50-week moving average crossed below the 200-week moving average in early December 2024. It was a heads-up that Winnebago Industries had developed major price weakness.
Weekly price chart
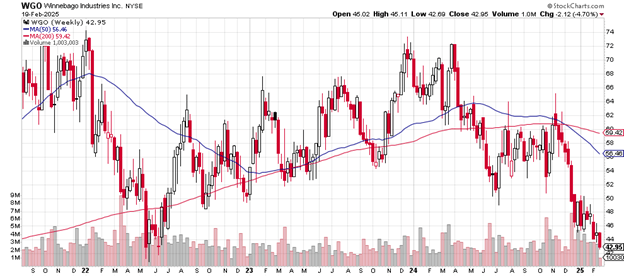
It’s not a bullish chart pattern to see that the 50-week and the 200-week moving average both are now trending down.
This week’s drop to new lows begins to approach the lows from mid-2022 when the stock hit just under $42. If it’s unable to find support at that level (buyers, that is), then anything lower would be the lowest in many, many years.
Winnebago has no price-earnings ratio because of a lack of earnings. EPS this year is down by 3.73% and down over the past five years by 34.02%.
The stock goes for a 2% discount to its book value.
The short float of 15.09% indicates that Wall Street money managers have noticed issues with the company, enough to not only sell the shares already owned but to short shares beyond that.
It’s a high figure and would help to fuel quite a short-covering rally should one ever develop.
The investment banking firm KeyBanc Capital Markets in early January upgraded their opinion of the stock from “sector weight” to “overweight” with a price target of $58.
Winnebago Industries pays a 3.05% dividend.
Charting the markets!
John Navin
Analyst, The Flash Report
Stats courtesy of FinViz.com. Charts courtesy of Stockcharts.com.
Not investment advice. For educational purposes only.