American Investors Looked Overseas - They Found This...
A sell-off, should one develop, might test the 50-week moving average at $4.56 – Wall Street algorithms are likely programmed to notice if the price drops to that level.


Mizuho Financial (MFG), the Tokyo-based financial services firm rallied 2.55% Friday for a new high and an extraordinary run-up from the August 2023 low.
Mizuho is one of the largest in its field with a market capitalization of $76.08 billion and operations worldwide. It has been in business for more than 150 years.
The stock is up as American investors have been looking overseas for investment opportunities and finding them.
The daily price chart is here.
From the early August 2024 dip that took the price down to $3.50 to the Friday close of $6.04 is a gain of 72% for investors who bought then and hold now.
Daily price chart
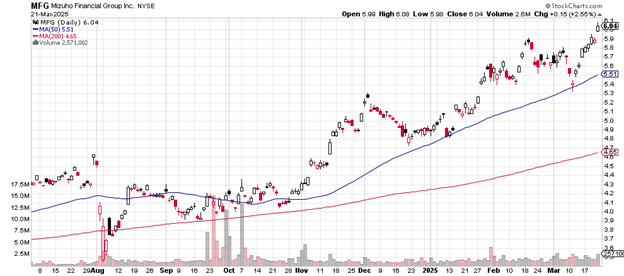
Friday’s volume for Mizuho was 2.572 million shares which compares to average daily volume of 1.37 million – almost a double – confirming just how intrigued with the stock buyers had become.
Notice how the 50-day moving average has never dipped below the 200-day moving average over the entire term of this chart. It consolidated in a sideways pattern from August 2024 through early November 2024 and then took off upward again.
The 200-day moves higher steadily and clearly.
The initial level for support, should selling overcome buying, might be the mid-March low just above $5.30. That would take the price to just below the 50-day moving average.
Below that, the next level of support, if an unloading of shares picked up, is likely to come in near the December 2024 low just above $4.70.
The weekly price chart is here.
The low October 2022 low near $2.20 was quickly followed by strong late-year buying that took the price above the 50-week moving average AND the 200-week moving average by December 2022.
Weekly price chart
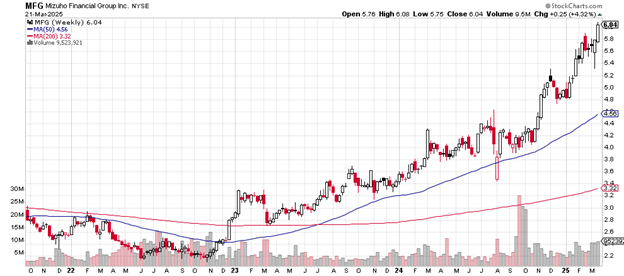
Following a January 2023 high near $3.30, Mizuho consolidated, dipped, and then began an upward ascent with the 50-week moving average crossing above the 200-week in late June/early July 2023.
That the current price of $6.04 is now so far above both moving averages measures suggests remarkable investor interest in the stock.
Key support lies near the $4.80 level, the December 2024/January 2025 lows where buyers returned and kept at it.
A sell-off, should one develop, might test the 50-week moving average at $4.56 – Wall Street algorithms are likely programmed to notice if the price drops to that level.
Mizuho Financial trades with a price-earnings ratio of 13 and at 1.14 times book value. The debt-to-equity ratio is 5.88. This year’s earnings are up by 34.68% and up over the past five years by 40.08%.
The company offers investors a dividend of 2.86%.
Charting the markets!
John Navin
Analyst, The Flash Report
Stats courtesy of FinViz.com. Charts courtesy of Stockcharts.com.
Not investment advice. For educational purposes only.