Bell's "Invention" Keeps Paying Out
The first thing you notice is the powerful uptrend from the mid-2023 lows to the present and especially the uptrend that kicked in once the 50-week moving average crossed above the 200-week moving average in mid-2024.


This big S&P 500 and S&P 100 component, AT&T (T) is enjoying quite a rally in 2025 and Tuesday continued the upward move with a gain of 0.77%.
AT&T’s market capitalization is $187 billion. The telecommunications services company early in the year reported fourth-quarter earnings that beat expectations and also announced an upcoming buyback of shares.
That’s the background for the strong series of positive sessions since the report.
The daily price chart looks like this.
Daily price chart
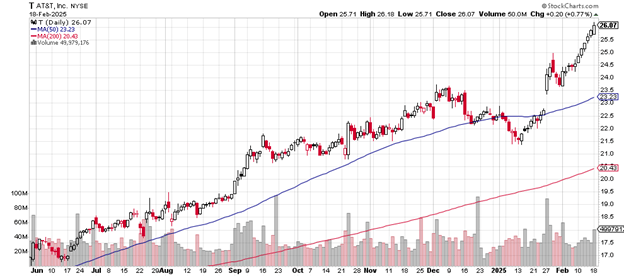
That’s seven straight days of advancing price, not something that you see very often among large-cap stocks like this. Tuesday’s gain comes with volume expansion, typically a confirming sign of trend direction: 52.43 million shares traded compared to average daily volume of 36.56 million.
The stock trades well above the 50-day and the 200-day moving averages, both of which keep heading higher.
The gain from the late July 2024 low near $17 to Thursday’s closing price of $26.07 amounts to a 34.6% advance.
That gap up in mid to late January from $22.75 to $23.75 is a likely support area if a sell-off should gather strength and re-test that zone where buyers had re-entered.
If selling were to continue from there, the next most likely support area is the early January low of just under $21.50.
The weekly price chart is here.
The first thing you notice is the powerful uptrend from the mid-2023 lows to the present and especially the uptrend that kicked in once the 50-week moving average crossed above the 200-week moving average in mid-2024.
Weekly price chart

The extension of the rally as the year 2025 progressed is quite impressive. From the standpoint of basic technical analysis, it might be good to see a bit of backing and filling. That said, rallies sometimes can continue for longer than expected.
Only a close or two below the 50-week moving average would call this remarkable uptrend into question. Such a move would take the price back to the area of the January gap up, by coincidence.
AT&T’s price-earnings ratio is 17.47. This year’s earnings are down by 7.65% and down over the past five years by 4.67%. The company founded in 1877 by Alexander Graham Bell as “The Bell Telephone Company” pays a 4.29% dividend.
The investment firm Exane BNP Paribas on February 13th upgraded AT&T from “neutral” to “outperform” with a price target of $28.50. Morgan Stanley in mid-December 2024 had upgraded the stock from “equal weight” to “overweight” with a price target of $28.
Charting the markets!
John Navin
Analyst, The Flash Report
Stats courtesy of FinViz.com. Charts courtesy of Stockcharts.com.
Not investment advice. For educational purposes only.