Big Move Up, But Still in a Downtrend
The big gap up in price is notable but it’s also notable that CVS Health didn’t make it up to a new high for the year with the announcement.


CVS Health (CVS) gained 14.95% on Wednesday.
The company reported fourth-quarter earnings that beat analysts’ expectations and provided positive “guidance” about the next twelve months.
The big gap up in price is notable but it’s also notable that CVS Health didn’t make it up to a new high for the year with the announcement.
The healthcare plan firm is an S&P 500 component and a member of the Health Care Select Sector SPDR (XLV), a widely followed (and purchased) exchange-traded fund.
The company competes with United Healthcare (UNH), Walgreens Boots Alliance (WBA), Humana (HUM), Cigna (CI), and others in the sector.
The daily price chart is here.
Up $14.95 in one day on big volume is bullish. That the gap up took the price above both the 200-day moving average (the red line) and, at the same time, above the 50-day moving average (blue line) is bullish as well. It’s hard to complain.
Daily price chart
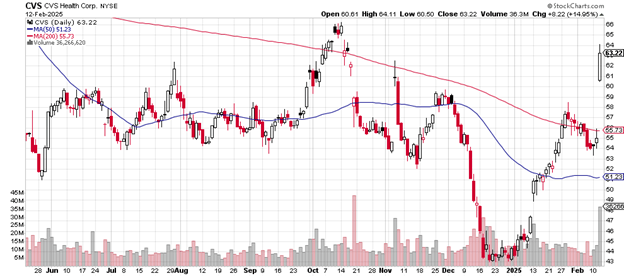
A higher high would have completed the picture, but the stock ran into sellers as the price approached the October 2024 peak of $66.
Wednesday’s volume is 36,535,449 shares traded, which is much greater than average daily volume of 13.15 million shares. This expansion of volume confirms the dramatic move upward as buyers took over.
Both the 200-day and the 50-day moving average have been trending downward but with this gain, they are likely to begin trending upward again. This might take a few weeks for the longer-term measure but the near-term one might see it as soon as next week.
Here’s the weekly price chart.
You can see that CVS Health has a long way to go to reclaim the high of just under $100 in early 2022. The stock cleared the 50-day moving average Wednesday and the next challenge will be the October/November high near $66.
Weekly price chart
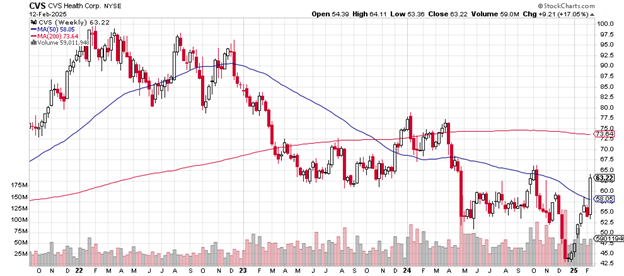
Even with the steadily eroding price over the last few years, it’s only recently – December 2024/January 2025 – that the 200-week moving average turned downward.
Another way of expressing this is: that CVS Health remains in a downtrend despite Wednesday’s spurt of big volume buying.
The company has a market cap of $79.6 billion. The price-earnings ratio is 16.06. The stock trades at 1.06 times its book value. The debt-to-equity ratio is 1.10. Earnings this year are up by 8.12%. CVS Health pays a 4.04% dividend.
The short float of just 1.7% indicates a lack of interest from the short-selling community.
The investment firm Cantor Fitzgerald on Wednesday upgraded the stock from “neutral” to “overweight.”
Charting the markets!
John Navin
Analyst, The Flash Report
Stats courtesy of FinViz.com. Charts courtesy of Stockcharts.com.
Not investment advice. For educational purposes only.