Gold Stock Powers Ahead of Gold Price
Neither gold nor silver had enough power to make it up to new highs during the trading session, but this stock has...

Toronto-based gold and silver miner, Franco-Nevada (FNV), hit a new 52-week high on Wednesday. That outperforms most other publicly traded names in the sector and even outperforming the price movement of the metals themselves.
Neither gold nor silver had enough power to make it up to new highs during the trading session. Investors are showing – with this type of pattern – that they especially like the prospects for Franco-Nevada when compared to similar purchases that could be made.
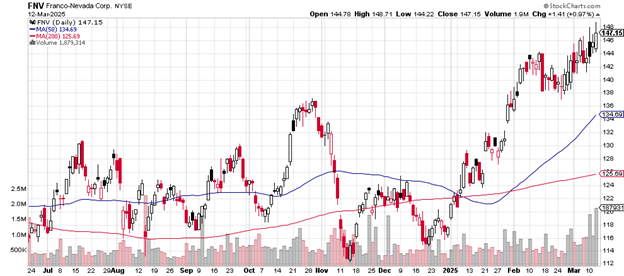
Here’s the daily price chart.
The new high is accompanied by an explosion of volume: during Wednesday’s trading, 1.879 million shares changed hands. That’s about three times average daily volume of 664,000 shares, signaling the strong level of buyers' commitment to the trade.
Daily price chart

The move from the November 2024 low near $112 to the present $147 amounts to a gain of 31.25% from the bottom to the top.
The 50-day moving average crossed above the 200-day moving average in late January 2025 and the price now remains well above both measures.
The mid to late February lows near $138 are the likely support zones if a large amount of selling comes in.
The late January 2025 gap-up from near $132 to near $134 is another likely support area to look for on any kind of sell-off.
Under those levels is the unfilled gap up near $126/$127 where the 200-day average now sits. Coincidentally, that’s a likely support area as well to be considered if unusually strong selling unfolded (not that I expect it, but you never know.)
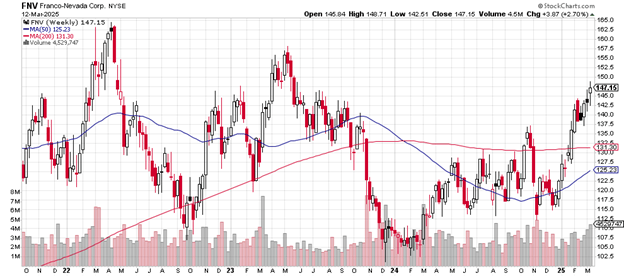
Here’s the weekly price chart.
If you draw a line that connects the March/April 2022 high with the May 2023 high, you’ll notice this week’s price action briefly crossed above it, and now remains close to it. A close above that line would be a trendline breakout.
Weekly price chart

The 50-week moving average has been trending upward since October 2024. It seems to be headed for a crossover above the 200-day moving average, perhaps in a few weeks.
Franco-Nevada has a market cap of $28.32 billion. The price-earnings ratio of 51 is high when compared to other stocks in the sector or to the S&P 500 as a whole. One reason may be this: the debt-to-equity ratio is zero, with no long-term debt or any other kind.
This year’s earnings are up 23% and up over the past five years, 9.38%.
TD Securities on March 11th downgraded their opinion of Franco-Nevada stock from “buy” to “hold” with a price target of $152.
The company pays a 1.03% dividend.
Charting the markets!
John Navin
Analyst, The Flash Report
Stats courtesy of FinViz.com. Charts courtesy of Stockcharts.com.
Not investment advice. For educational purposes only.
