Gold Up, Gold Stocks Up More...
The thinking was that “no rate cut” could mean higher inflation and thus help the price of the most famous inflation hedge: gold.

Gold miner, Gold Fields Ltd (GFI) was up 2.67% yesterday as the Fed announced there would be no interest rate cut now but maybe later in the year.
The thinking was that “no rate cut” could mean higher inflation and thus help the price of the most famous inflation hedge: gold.
The price of the yellow metal headed higher and with it, gold stocks like Goldfields. The South African company has a market cap of $19.58 billion and trades with a relatively low price-earnings ratio of 16.
The daily price chart looks like this.
From the late December 2024 low near $13 to Wednesday’s closing price of $21.88 is a stunning 68% gain in less than three months, for those who caught the bottom and held on.
Daily price chart
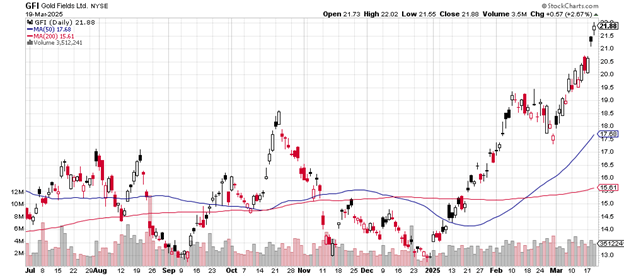
Volume expanded from the average daily of 2.97 million to Wednesday’s 3.512 million shares traded, an indication of the underlying buying strength.
The 50-day moving average appears to be headed almost straight up after crossing above the 200-day moving average in mid-February. The 200-day is turning upward now, at a slower pace.
Should selling begin, the first place to look for support might be the late February low near $17.50. Note that’s about where the 50-day moving average now sits.
The weekly price chart looks like this.
The price has made it up to new highs for three weeks in a row and this week’s gain (for now) is a strong 8.42%.
Weekly price chart
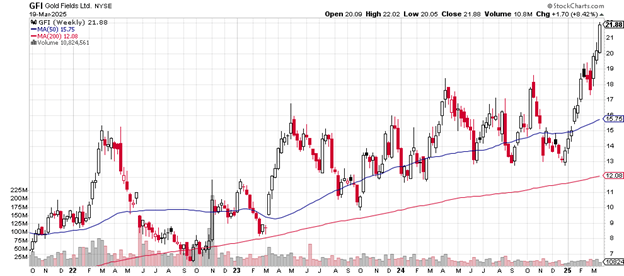
Goldfields in February broke above the previous resistance of just above $18, sold off as that month progressed, and then blasted upward as March unfolded.
The 50-day moving average is trending higher – you can see that it’s never dropped below the 200-day moving average over the three-plus years of this chart. There have been lots of ups and downs but that basic measure of trend has remained upward.
The only time the price has dipped below the 200-day moving average was in late August 2022 through November 2022. From that base, the long-term trend measure has never strayed from up.
Support on this weekly chart appears at the late February 2025 level of near $17.50. A more severe sell-off might test the late December 2024 lows near $13.
This year’s earnings are up 58.41% and up over the past five years by 48.09%. The debt-to-equity ratio is 0.57.
The stock represents 4.77% of the VanEck Gold Miners Exchange Traded Fund (GDX), a widely followed measure of the gold stocks sector’s performance.
Goldfields pays a dividend of 3.97%.
Charting the markets!
John Navin
Analyst, The Flash Report
Stats courtesy of FinViz.com. Charts courtesy of Stockcharts.com.
Not investment advice. For educational purposes only.