Goldman Sachs Got Out Just in Time...
The lack of even just a bounce at the $257.50 area isn’t good — the sellers were intent on just getting out.


This new low is not a good sign for General Dynamics, a defense contractor with a market cap of $69.90 billion.
The company just reported positive quarterly earnings that beat Wall Street analysts' expectations. Instead of buying on the news, sellers have taken over.
This is odd behavior to see. Typically, in such a situation, buyers would appear. Some reports suggest that investors are cautious in the wake of possible budget cuts to the U.S. Defense Department from the federal government.
The daily price chart shows a deep drop…
Daily price chart
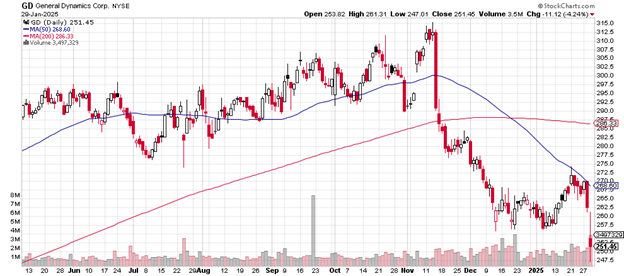
The price took out the support level of the December and early January lows, a troubling sign for GD investors. The lack of even just a bounce at the $257.50 area isn’t good — the sellers were intent on just getting out.
The 50-day moving average crossed below the 200-day moving average in mid-December sending out a warning signal to those paying attention.
Note how a mid-January rally could not make it above the 50-day moving average. Every time the stock attempted to cross that level, sellers took over and prevented the move. This type of pattern on a chart is something of a warning.
Today’s red candlestick is a conclusive one: it’s a very large downward print and then buyers attempted to regain the energy and failed. They took it about halfway back and at that point, the big selling returned. This is weakness, the real thing.
It wouldn’t be surprising to see an up day soon after such intense one-day selling, but the price would need to clear that 50-day moving average before any excitement is warranted.
One more factor from the daily price chart: note how the 200-day moving average has begun to turn over and head downward. This longer-term chart look is not bullish.
Here is the weekly price chart for General Dynamics.
The steady price slide from the November peak to the present level takes it well below the 50-week moving average.
The next level of support may be the area of the up-trending 200-week moving average at the $229 level.
Weekly price chart
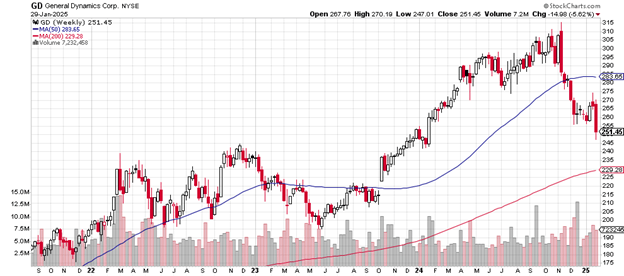
Under that initial support level is the early October 2023 gap up in price from $218 to $222. If the popular technical analysis phrase ‘gaps get filled,’ is correct, then that is another spot likely to find buyers.
That the 200-week moving average continues to trend higher is a positive for the stock, at least for now.
It’s fascinating to see that some big investment houses had downgraded their ratings of General Dynamics only a few weeks ago. Goldman, for example, on December 12th, 2024 reduced its opinion of the stock from “neutral” to “sell.” Robert W. Baird took GD on January 14th, 2025 from “outperform” to “neutral.”
Nice timing.
Charting the markets!
John Navin
Chief Technical Analyst, The Flash Report