Honeywell Breaks Up, Nobody Cares
Honeywell International announced its decision to break up into three separate companies, and the response on Wall Street was in the 'less than thrilled' category.

Honeywell International (HON) announced its decision to break up into three separate companies, and the response on Wall Street was in the “less than thrilled” category.
The stock closed down 5.6% on the heaviest volume of the year, a clear sign of investor dissatisfaction.
Thursday’s volume was 11,953,619 which greatly exceeds average daily volume of 4.03 million.
As one of the 30 Dow Jones Industrials component stocks, Honeywell International, based in Charlotte, is widely followed and deeply researched by well-paid analysts with MBAs working for key investment firms.
The stock is also a member of the S&P 500 and the NASDAQ-100.
The daily price chart looks like this.
The gap down takes the price to a close below the 200-day moving average, never a hopeful sign in the first place. But definitely not after a major announcement. The market immediately disliked the division of the company into three without hesitation.
Daily price chart
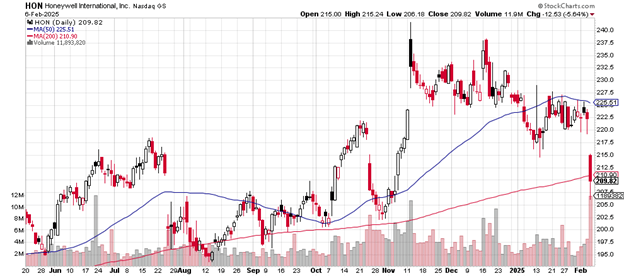
Honeywell since mid-January had been trading below the 50-day moving average, unable to close above it. That measure had already turned down and Thursday’s selling is likely to turn it even further in that direction.
Purchases of shares at $242 at the November peak now go for $209.82, a loss in value of 13.3% in less than three months.
Honeywell International now joins Nike (NKE) as one of the Dow Jones Industrials trading below both their 50-day and 200-day moving averages.
The weekly price chart is here.
The price dipped below the up-trending 50-week moving average and, at that point, found buyers. If the slide continues, sellers may run into buyers at the August 2024 low, the previous support level. This happens to more-or-less coincide with the level of the up-trending 200-week moving average.
Weekly price chart
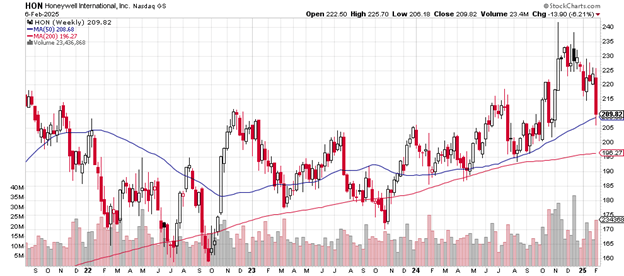
The next significant support may lie at the late October 2023 low of $170 or, if selling becomes really serious, a test of the 2022 low near $160 would be next.
Note that for now at least the price remains above both the 50-week and the 200-week moving averages and both measures continue to trend upward.
The market cap for Honeywell International is $136.4 billion. The stock trades with a price-earnings ratio of 24.23. Earnings this year are up by 10.4% – and down over the past five years by 1.2%. The company offers investors a 2.2% dividend.
Reports have it that Elliott Investment Management had pressured Honeywell to break up.
Charting the markets!
John Navin
Analyst, The Flash Report
Stats courtesy of FinViz.com. Charts courtesy of Stockcharts.com.
Not investment advice. For educational purposes only.