How China Crushed Nvidia's Stock Price...
NVIDIA had been the stock with the greatest market capitalization but after today’s selling, both Apple and Microsoft are larger again.

NVIDIA (NVDA) is the leading designer of artificial intelligence chips and one of the most actively traded stocks on the NASDAQ. It has a market capitalization of $2.9 trillion.
The stock today dropped an extraordinary 17% as increased awareness of the China-developed AI known as DeepSeek took down almost the entire tech sector.
The prices charts show that Wall Street money managers now are deeply concerned about the China effect on U. S. AI favorites like NVIDIA.
Now for the charts. Today, we’ll look at the daily and weekly charts.
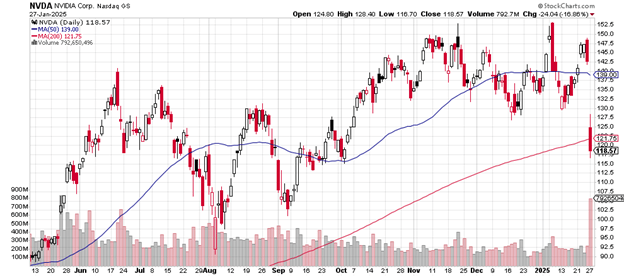
This daily price chart shows the extent of the damage to the stock in today’s trading.
It’s something we haven’t seen too often lately in the big tech sector: a close that comes in below both the 50-day moving average and the 200-day moving average. All in one session.
It’s the most volume with more selling than buying on the entire price chart (the volume indicator appears along the bottom of the price chart), a confirmation of price weakness.
Daily price chart

Plus, the 50-day moving average has turned downward now (blue line above).
It’s also worth noting today’s drop in price takes out the mid-December low
The extent of today’s sell-off suggests the possibility that NVIDIA may re-test the September and August lows.
Since the 200-day moving averages are often noticed and acted on by Wall Street algorithms, we’ll likely see more selling of the programmed variety.
The underperformance compared to other NASDAQ tech stocks is glaring: Apple, for example, was up today by 3.25%. Old school AT&T gained 6.29% for a new high.
That NVIDIA today tanked by 16.97% is quite a new vibe for what has been one of the hottest of the NASDAQ tech stocks.
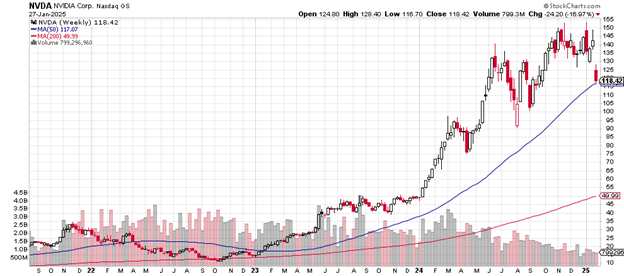
The weekly price chart looks like this now, as it challenges the up-trending 50-week moving average, the blue line that NVIDIA stock has been above since early 2022:
Weekly price chart

The gap down is extraordinary. I can see no others of that magnitude on this price chart.
The early August 2024 low would appear to be the likely target in the event of continued significant selling. Such a closing price comes in below the 50-week moving average, an event likely to be noticed by the big algorithm programs and not in a bullish way.
This major tech stock in the artificial intelligence sector had been on fire up until today’s session: note how the 200-week moving average trends steadily upward for months.
NVIDIA’s price remains astonishingly much higher than that measure, something you don’t see on too many charts whether of the NASDAQ or of S&P 500 components.
NVIDIA had been the stock with the greatest market capitalization but after today’s selling, both Apple and Microsoft are larger again.
CEO Jensen Huang is now $21 billion poorer after the remarkable Monday session. His net worth fell from $124.4 billion to $103.1 billion.
Charting the markets!
John Navin
Analyst, The Flash Report
