It's Not Just AI Stocks Popping Higher
Lots of ups and downs appear on this chart. But the breakout above the previous highs is clear...


On Thursday, Yum Brands (YUM) gapped up in price after reporting quarterly earnings that came in above analysts’ expectations.
It continued higher early Friday before sellers took over. Yum Brands operates more than 59,000 well-recognized restaurant locations including Taco Bell, KFC, Pizza Hut, and Habit Burger and Grill.
The Louisville, Kentucky-based firm surprised a few restaurant-picking experts. On January 21st, Morgan Stanley had downgraded their opinion of the company from ‘overweight’ to ‘equal weight,’ and Citigroup on January 10th had reduced Yum from ‘buy’ to ‘neutral.’
Here’s what the daily price chart looks like.
The big red circle to the right side of the chart shows how dramatic last week’s breakout was.
Daily price chart
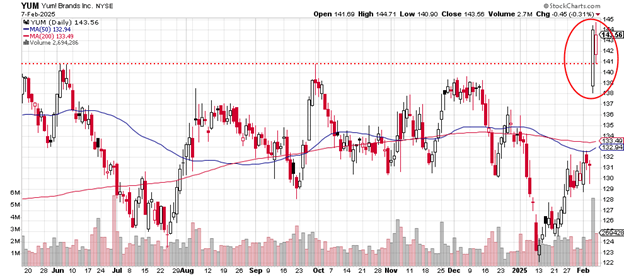
That the price had been trading below both the 50-day and the 200-day moving averages shows how investors had given up on near-term growth prospects.
The surprisingly positive earnings report forced short-sellers to cover positions and attracted new money as the early June 2024 high and the late September 2024 high were taken out.
The light greyish bar underneath the Thursday price candlestick shows the most volume on the chart. More than five million shares traded versus the usual average daily volume of 1.8 million.
The 50-day moving average is turning upward and – barring any extraordinary news – is likely to cross above the 200-day moving average this week.
The weekly price chart is here.
Lots of ups and downs appear on this chart. But the breakout above the previous highs is clear – the red dotted line that connects the April and June 2024 highs is where selling resistance had shown up.
Weekly price chart
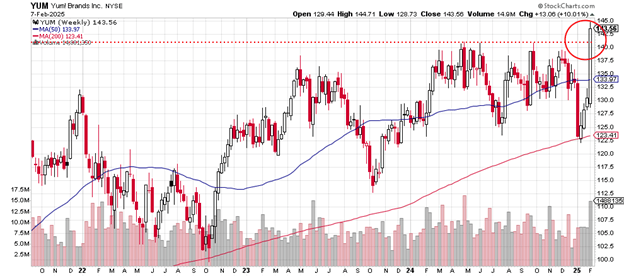
Higher highs such as this, especially those that clear former resistance levels, are generally positive. But it’s important to keep in mind there are no guarantees this upward progress will continue.
The 50-day moving average remains above the 200-day moving average for the entirety of the three-plus years on this price chart.
Note the relentless pursuit of higher ground taken by the 200-day moving average for the entire period – no dips.
The market capitalization for Yum Brands is $40.1 billion. So, it’s big but not as big as McDonalds (MCD) which has a market cap of $210.90 billion.
They’re different restaurant operations but similar enough to make certain types of comparisons. McDonalds hit a new high late last year but has not made higher so far in 2025.
Yum trades with a price-earnings ratio of 27. This year’s earnings are up by 11.3% and up over the past five years by 4.8%.
The brand pays a 2% dividend.
Charting the markets!
John Navin
Analyst, The Flash Report
Stats courtesy of FinViz.com. Charts courtesy of Stockcharts.com.
Not investment advice. For educational purposes only.