Just When Investors Thought it Couldn't Get Worse...
From the July peak of $94 to the present $72.28 amounts to a 23% loss in seven months for investors who may have bought at the top and have held onto shares since then.

Textron (TXT) dropped 1.12% to a new 52-week low on Friday.
With a market cap of $13.20 billion, the firm is an S&P 500 component – also of the iShares U. S. Aerospace and Defense ETF (ITA) and the SPDR S&P Aerospace and Defense ETF (XAR).
Business competitors include Lockheed Martin (LMT), Boeing (BA), General Dynamics (GD), Northrop Grumman (NOC), and others in that sector.
Textron in late January had reported a fourth quarter that came in below expectations. Since then, it has been unable to find buying strength. That lack of strength was in place before the quarterly report as you can see by a quick study of these price charts.
Here’s how the daily price chart looks.
From the July peak of $94 to the present $72.28 amounts to a 23% loss in seven months for investors who may have bought at the top and have held onto shares since then.
Daily price chart
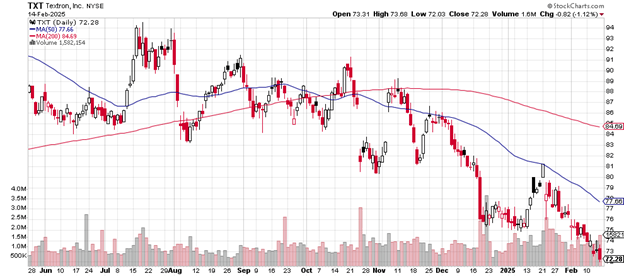
Volume expanded on Friday’s selling: 1,582,154 shares traded, greater than average daily volume of 1.23 million shares. From a technical analysis standpoint, that’s a confirming sign of bearish action.
The 50-day moving average crossed below the 200-day moving average in early October, a warning signal for those paying attention. The price now trades well below those two measures, both of which continue to trend downward.
For Textron to be considered bullish again would require a rally to above the 50-day moving average now at $77.66 and then above the previous high of just above $81. That mid-January support is where sellers overcame buyers and should be considered a serious resistance level.
Here’s the weekly price chart.
It’s a problem that the price is now below the 200-week moving average. This is the kind of chart event that shows up on the screens of Wall Street money managers and their algorithms programmed to notice such patterns.
Weekly price chart
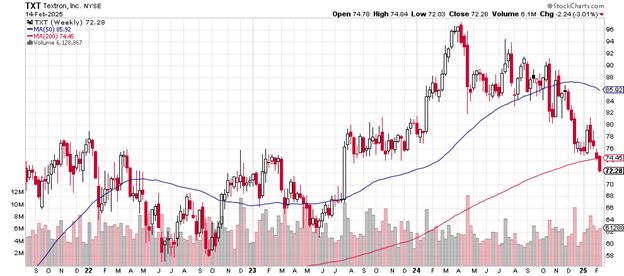
It’s also a problem that the 50-week moving average is turning downward after such a nice, steady run-up from the May 2023 low of $61. That low is a likely support area if the stock continues to sell off. More serious selling would likely test the 2022 support zone near $58.
Generally, Textron’s price-earnings ratio of 16.73 is a reasonable metric for equity in this sector. The “forward” p/e, based on analysts' expectations for the coming year, is 10.39 which would take it into value stock territory.
The company pays a 0.11% dividend.
Bank of America Securities on January 24th downgraded their opinion of Textron from “buy” to “neutral” with a price target of $85.
Charting the markets!
John Navin
Analyst, The Flash Report
Stats courtesy of FinViz.com. Charts courtesy of Stockcharts.com.
Not investment advice. For educational purposes only.