Just When Will This Falling Global Brand Rebound?
This is a remarkable underperformance for such a major globally recognized brand name at a time when the major stock market indexes are at or near new highs.


Today we’re looking at Nike Inc (NKE). The $108 billion market cap footwear company founded by Phil Knight.
Earlier this month, the price revisited the July and August 2024 lows near $70.
A recent January rally lifted the stock off of that level but is now unable to find enough buyers to take it above the down-trending 50-day moving average (the blue line).
Daily price chart
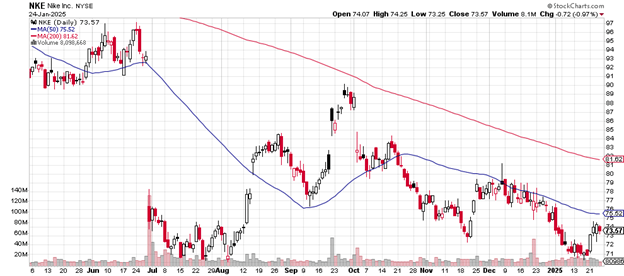
You can see how the 200-day moving average (the red line) continues to trend downward relentlessly. Nike has remained below it for months.
That late June gap down represents a 20% one-day drop in price after the company reported a 2% decline in quarterly sales.
It came with a warning that Nike expects a year-over-year decline of 10%. That’s far greater than what analysts had previously expected.
Note that the August to September rally failed to fill that enormous gap down.
A close below that $70 support would indicate that holders of the stock have given up on price gains, at least for the near term.
That both of the significant moving averages are in downtrend mode is not a helpful sign for those who are bullish on the footwear maker.
Investors need to see a price above the 200-day moving average to become optimistic again.
Now we’ll look at Nike’s weekly chart.
The 50-week moving average crossed below the 200-week moving average in December 2022. That’s an alert for those paying attention that the stock’s weakness had become serious and troubling.
Nike rallied for a few months to just above $125 after that crossover and then began fading again at the beginning of May 2023.
Weekly price chart
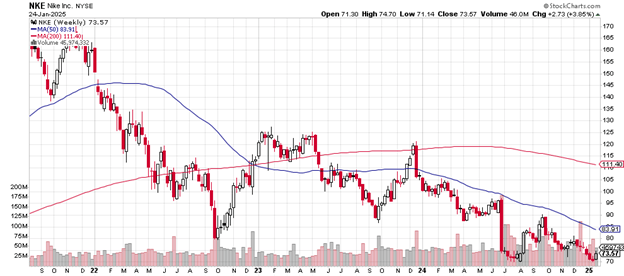
The September 2023 low was $83. Buyers returned and took the price back to above the 200-week moving average but only briefly in November/December 2023.
Selling returned and the stock hasn’t traded above that measure since then. That’s a sign of just how weak it’s become.
Especially when compared to the hot tech and social media names of the NASDAQ-100 which had continued to rise, many to new all-time highs.
This weekly price chart makes apparent the importance of the $70 price level: a break below it is likely to bring in the programmatic selling of Wall Street algorithms.
Finally, the monthly chart.
From the 2021 peak price of just above $170 to the current $73 amounts to a drop of 57%.
This is a remarkable underperformance for such a major globally recognized brand name at a time when the major stock market indexes are at or near new highs.
The monthly chart
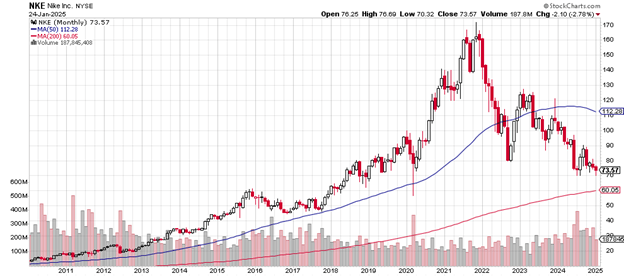
Note that the stock trades below the 50-month moving average. That early 2020 low of just below $60 is a likely support area, especially with the up trending 200-month moving average arriving at just about the same spot.
We’ll continue watching Nike, looking for a rebound.
Charting the markets!
John Navin
Analyst, The Flash Report