Kentucky Fried China!
The buyers have taken control with a price well above the 50–day moving average and well above the up-trending 200-day moving average.


Yum China Holdings (YUMC) is breaking out above the previous resistance levels as investors begin to find Asian (and European) equities again.
Yum China operates name-brand restaurants in that country quite familiar to Americans such as KFC (formerly Kentucky Fried Chicken), Pizza Hut, Taco Bell, and a few others.
Based in Shanghai, the consumer cyclical company has a market cap of $20.05 billion.
Here’s the daily price chart.
The highs of October 2024, November 2024, and December 2024 have been broken through with the last two days of action.
Daily price chart
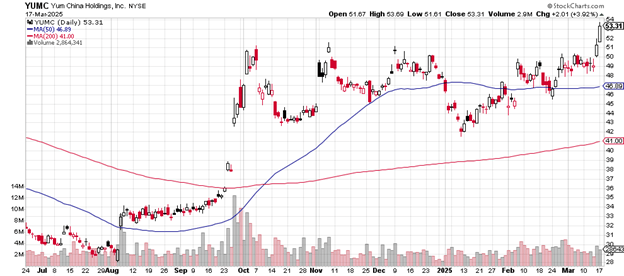
This kind of move past previous serious resistance is considered bullish by technical analysts – those who had been selling at those earlier prices are no longer selling.
The buyers have taken control with a price well above the 50–day moving average and well above the up-trending 200-day moving average. You can see in October 2024 where the 50-day crossed above the 200-day in a type of generally bullish signal.
If selling returns, the most likely area of initial support would likely be the late February low of just under $46. A few sessions of more intense selling might take the price down to the January low of the $42 level.
Although volume has picked up over the last two days, the levels are at much lower levels than the late September/early October 2024 volumes. This type of indicator may suggest a lessening of upward intensity – to see how this develops will be interesting.
Here’s the weekly price chart.
The price is above the 2024 highs and the next level of resistance may show up at the $57 level where the price topped briefly in September 2023.
Weekly price chart
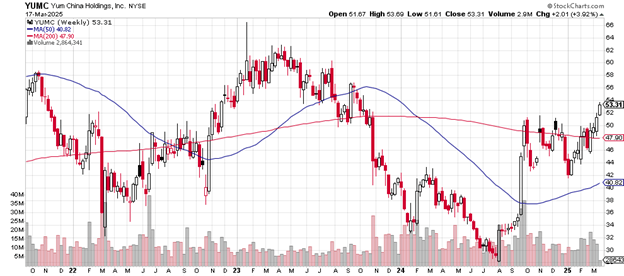
Above that are months of trading in the $58 to $62 area: this is likely to become resistance to buying. The peak price just above $66 in January 2023 would be the ultimate goal for those making purchases now.
It’s a positive that Yum China now trades above its 200-week moving average and that its 50-week moving average is heading higher.
The stock’s price-earnings ratio is 22.91, below that of the S&P 500’s p/e which now sits at 35.49. The debt-to-equity ratio is 0.42. This year’s earnings are up 9.47% and up over the past five years by 4.31%.
In early November 2024, JP Morgan upgraded their opinion of the China-based company from “neutral” to “overweight” with a price target of $60.
Yum China Holdings pays a 1.71% dividend.
Charting the markets!
John Navin
Analyst, The Flash Report
Stats courtesy of FinViz.com. Charts courtesy of Stockcharts.com.
Not investment advice. For educational purposes only.