Market Soars, This Stock Doesn't...
The CEO is one of the major contributors to Donald Trump’s 2024 campaign. It’s odd to see a sector name brand do so poorly on such a strong day for big indexes.

Despite the market having a good day (S&P 500 +1.76%, Nasdaq 100 +2.16%), major casino/resort stock, Las Vegas Sands (LVS) ended the session down 1.03%.
Las Vegas Sands has major properties in Southern Nevada and Macau. The CEO is billionaire Miriam Adelson, one of the major contributors to Donald Trump’s 2024 campaign. It’s odd to see a sector name brand do so poorly on such a strong day for big indexes.
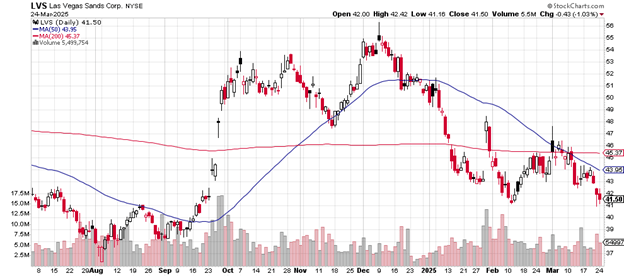
Here’s the daily price chart.
The Monday candlestick is an “inside” day: that is, the price traded no higher than Friday’s session and traded no lower either. Typically, this is thought to mean that investors are now undecided about the future direction of the stock.
Daily price chart

Notably, Friday’s low dropped lower than the early February low: that support level proved weak and today’s trading failed to improve the look.
The 50-day moving average crossed below the 200-day moving average two weeks ago and the price has been unable to close above either measure since that moment.
If a rally takes place, the price will need to cross above both of those measures and then overcome the resistance at the early March high of $47.75 and the late January high of $48.50.
The next level for likely support, in the event of more selling, might be the late August 2024 low near $38 and below that the early August low of near $36.
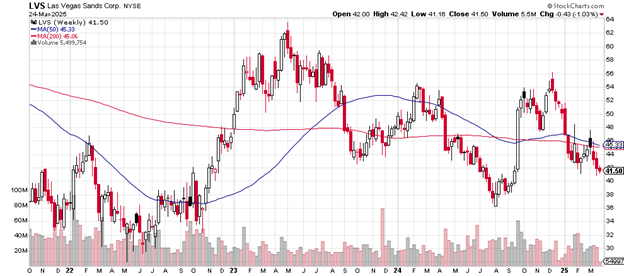
Here’s the weekly price chart.
This is the third week of a price below both the 50-week moving average and the 200-week moving average, an indication of the lack of strength.
Weekly price chart

The December 2024 high of just above $56 is the area of significant possible resistance if buyers move back into the stock.
The most likely support level on this weekly chart is the August 2024 low near $36 where buyers took over from sellers.
The trading range starts with the March 2022 low of near $28 and finds a top in early March 2023 of almost $64. The stock has stayed within that low and high price for the past two years.
Las Vegas Sands has a market cap of $29.71 billion. The price-earnings ratio is 21.20. The company has a debt-to-equity ratio of 4.83. The short ratio is on the high side at 5.17% indicating the bearishness of those who are short. Should a rally begin to develop, short-covering could fuel it.
In early January, Jeffries upgraded its opinion of the stock from “hold” to “buy” with a price target of $69. In mid-January, Morgan Stanley downgraded its opinion of the casino/resort from “overweight” to “equal weight” with a price target of $51.
Las Vegas Sands pays a 2.36% dividend.
Charting the markets!
John Navin
Analyst, The Flash Report
Stats courtesy of FinViz.com. Charts courtesy of Stockcharts.com.
Not investment advice. For educational purposes only.
