Old Dot-Com Favorite Flies Again
Wall Street algorithms are programmed to prepare for this type of scenario in advance with sometimes highly complex stock and options positioning. But this was different...


Cisco Systems (CSCO), with a market cap of $254 billion, is one of the thirty Dow Jones Industrials. The San Jose, California-based company is a Nasdaq 100 stock and a component of the S&P 500.
It competes for tech business with Juniper Networks (JNPR), Hewlett Packard Enterprise (HPE), Palo Alto Networks (PANW), and others.
Cisco Systems (CSCO) closed at $63.84, a gain of 2.1%. But when trading opened, the stock had been up by about 8%.
Those not waiting to take profits made out the best as Cisco Systems took off to a new high after reporting a fiscal second quarter that beat expectations, similar to Palantir’s (PLTR) story last week.
Wall Street algorithms are programmed to prepare for this type of scenario in advance with sometimes highly complex stock and options positioning. What’s different about today’s Cisco trading is the suddenness of the profit-taking once the price hit $66 and the subsequent quick decline from that initial morning surge.
The main thing is: that’s a new all-time high and it comes with the most volume so far this year. That’s a confirming factor of the bullish quality of the move. The stock traded 43,179,485 shares on Thursday – average daily volume is 20.1 million.
Here’s the daily price chart.
The 50-day moving average crossed above the 200-day moving average in September 2024 and has remained above it since then.
Daily price chart
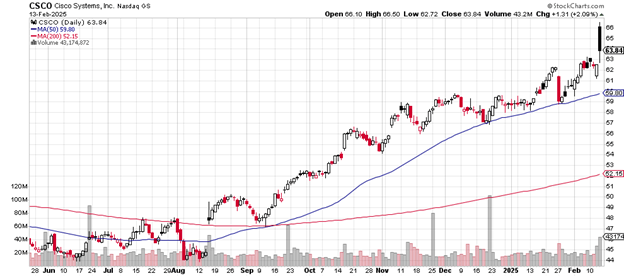
The price has stayed above the 50-day moving average (on a closing basis) since the August 2024 gap up from $45 to just above $47.
That gap would be a likely target for buyers on any serious sell-off, however unlikely that may now seem.
Note how the 200-day moving average climbs upward from mid-September 2024 to the present. It helps to be a tech stock lately.
The weekly price chart is here:
Weekly price chart
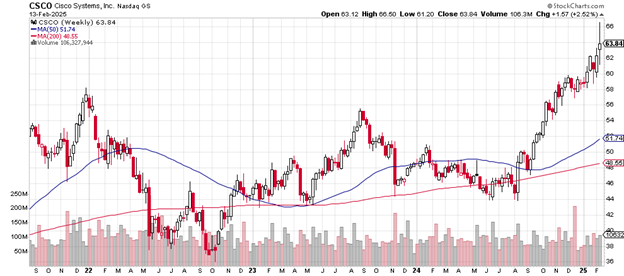
This week shows a peculiar weekly candlestick pattern with a greater movement above the closing price than below it. This may indicate how serious the sellers are at just above $66.
You can see how the late 2024 action had already exceeded the previous highs from late 2021 and from mid-2023. It’s icing on the cake that the year 2025 is off to such a powerful start.
The price is trading well above the 50-week and the 200-week moving averages, a sign of the strength in this stock.
The stock has a price-earnings ratio of 27.93. This is considered reasonable, especially when the p/e for the S&P 500 is 38.54.
Cisco offers investors a dividend of 2.54%.
Analysts at Rosenblatt Securities on Thursday upgraded the stock from “neutral” to “buy” with a price target of $80.
Charting the markets!
John Navin
Analyst, The Flash Report
Stats courtesy of FinViz.com. Charts courtesy of Stockcharts.com.
Not investment advice. For educational purposes only.