"Old Timer" Tech Stock Hits New High (Again!)
The information technology company, one of the most recognized brand names in the world, continues to be in uptrend mode with occasional sell-offs that eventually give way to new rallies.


This well-known and widely followed big tech firm, International Business Machines (IBM), is one of the 30 Dow Jones Industrial Average companies. It hit another new closing high on Thursday.
The information technology company, one of the most recognized brand names in the world, continues to be in uptrend mode with occasional sell-offs that eventually give way to new rallies.
IBM, with a market cap of $244.8 billion, is also a component of the S&P 500 and the SPDR Technology Select Sector ETF.
Seven days of gains in a row to a new all-time high: it’s not something you see that often, especially among Dow Jones Industrials with huge trading volumes and very large capitalizations.
Here’s the daily price chart.
Daily price chart
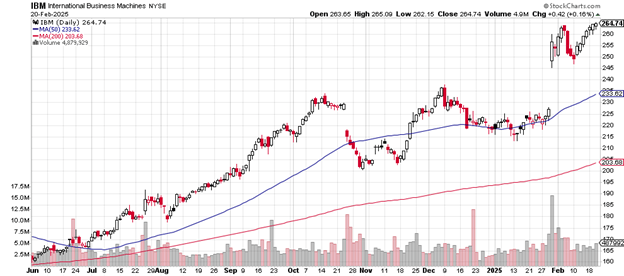
The 50-day moving average has remained above the 200-day moving average for the entirety of this chart, speaking of patterns that don’t show up often.
Both of those significant measures of price performance continue to trend higher and higher, factors likely to be picked up by the sensitive algorithms that track these types of characteristics on behalf of hedge funds and similar investing pools.
The late January gap up from near $228 to $245 is a likely target zone for traders should a bout of serious selling take place. The huge volume on that day, when IBM reported 4th quarter earnings, which exceeded expectations, indicates strong investor interest in that price range.
A complete fill of that gap from the selling of shares would return the price to below the uptrending 50-day moving average.
The October 2024 low near $200 is a likely support level for any further selling. This is the same price area for the up-trending 200-day moving average.
Here’s the weekly price chart.
Demonstrating just how powerfully in force this uptrend remains, you can see on this longer-term chart. The 50-week moving average trades above the 200-week moving average from late 2021 to the present. That’s a bullish trend.
Weekly price chart
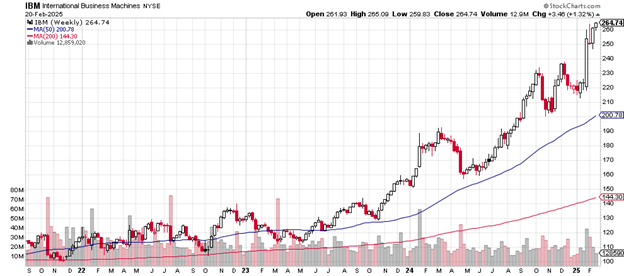
Both moving averages have been heading upward since late 2023, with no significant dips to speak of.
IBM’s price-earnings ratio of 41 places it slightly above the p/e of the S&P 500 as a whole, which sits at 38.58.
Business competitors for the company include Microsoft (MSFT), Alphabet (GOOG), Cisco Systems (CSCO), Oracle (ORCL), and a host of similar big tech names.
Wedbush, on February 3rd, “resumed” analyst coverage of IBM, and on February 11th, Oppenheimer “initiated” coverage with a price target of $320.
International Business Machine pays a 2.61% dividend.
Charting the markets!
John Navin
Analyst, The Flash Report
Stats courtesy of FinViz.com. Charts courtesy of Stockcharts.com.
Not investment advice. For educational purposes only.