Possibly the Market's Most Depressing Stock Chart...
Thought to be a hot concept in late 2022 and early 2023, the stock has been a disappointment to investors ever since.


Etsy (ETSY) slipped by 6% to close with a new 52-week low on Thursday and the continuation of a downtrend in place for months.
Etsy is the internet retail site that specializes in handmade items and in vintage goods (those produced more than 20 or more years ago). Thought to be a hot concept in late 2022 and early 2023, the stock has been a disappointment to investors ever since.
The daily price chart is here.
You can see how Thursday’s price drop broke below the previous support level from the late October 2024 low. All of those who had purchased Etsy stock from then to now are now at a loss on this position.
Daily price chart
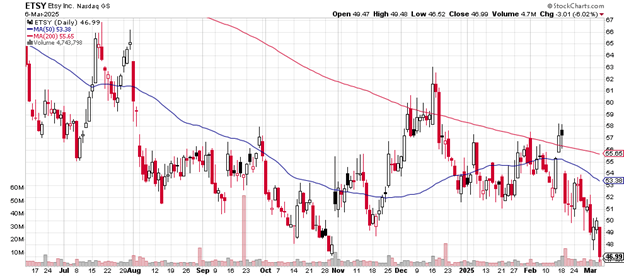
The session’s volume of 5.65 million shares traded is much greater than the average daily volume of 3.66 million, signaling how much investors wanted out.
Take a look at the relentlessness of the 200-day moving average’s downtrend. Then notice how the 50-day moving average has never traded above the 200-day for the period of the entire chart.
This, even as price moved above it for a few sessions in mid-December 2024 and mid-February 2025.
The drop from the July 2024 peak of near $67 to the current $46.98 amounts to a 30% loss of value from top to bottom, underperforming the major indexes and most other equities over the same period.
The weekly price chart is here.
This is an astonishing slide from near $300 in late 2022 to the Thursday closing price of $46.98. So, on a monthly scale, Etsy is down 84% for the time shown here.
Weekly price chart
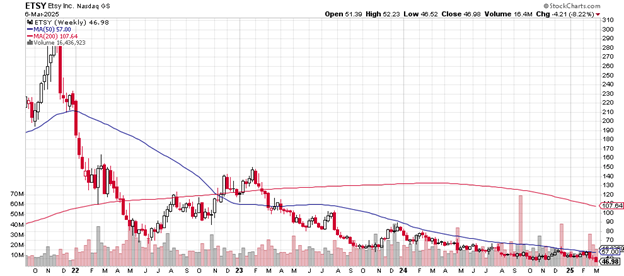
Note how the 50-week moving average crossed below the 200-week moving average in November 2023, a warning sign for analysts paying attention.
That 200-week moving average turned downward by April/May 2024 and continues to head south.
The price has been unable to climb above the 50-week moving average since May 2023, another indication of just how weak the stock now trades.
Etsy’s market cap is $5.03 billion. The price-earnings ratio is 19.80. The short float is way up to 18.90% suggesting the presence of Wall Street short selling funds. Any kind of rally might gain strength from a surge of short covering (not a prediction, just noted).
On January 13th, 2025, Jeffries upgraded their opinion of Etsy from “underperform” to “hold” with a price target of $55.
On February 21st, 2025, Raymond James lowered their price target for the company from $65 to $60.
Etsy does not pay a dividend.
Charting the markets!
John Navin
Analyst, The Flash Report
Stats courtesy of FinViz.com. Charts courtesy of Stockcharts.com.
Not investment advice. For educational purposes only.