Retail's Big Rally Comes to an End
Should heavy selling begin to take place, that very big mid-August gap up from near $68 to $73 may provide support: it’s an obvious zone where buyers overcame sellers last summer.


Monday’s NYSE sell-off did not spare the huge brand-name retail operation, Walmart (WMT).
Walmart slipped 4.25 %, an underperformer when compared to the S&P’s slide of 2.70%. The SPDR Retail ETF (XRT) dropped only 1.76% today, another bad comparison for the famous Arkansas-based multinational founded by Sam and Bud Walton.
The stock is a Dow Jones Industrial and an S&P 500 component.
The daily price chart is here.
The price peak of near $105 only lasted briefly in mid-February and seems a long way away from Monday's close of $87.82. That’s a 16.36% loss for those who purchased at the top and who continue to hold.
Daily price chart
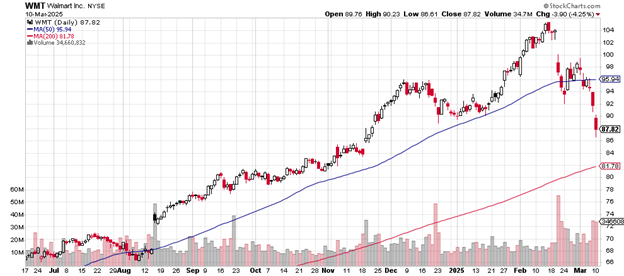
Session volume for Walmart was 35 million, almost twice average daily volume of 18.36 million, demonstrating the powerful force of Monday’s trading.
It’s the fifth day for the stock to close either below or just at the sideways-looking 50-day moving average.
The likely support area is near the mid-November gap up zone between $84 and $86. The up-trending 200-day moving average now at $81.78 may be a support level as Wall Street algorithms begin to notice that kind of proximity.
Should heavy selling begin to take place, that very big mid-August gap up from near $68 to $73 may provide support: it’s an obvious zone where buyers overcame sellers last summer.
The weekly price chart is here.
Weekly price chart
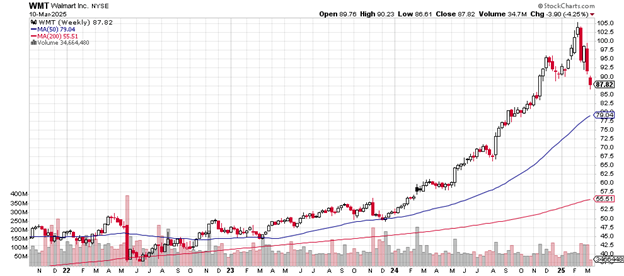
The stock’s rally from the May/June 2022 low of near $37.50 to this year’s peak of near $105 is an extraordinary run. It’s not all that surprising to see profits being taken after such a performance.
The price remains above the up-trending 50-day moving average and remains well above its up-trending 200-day moving average.
It looks as if the $80 level may provide support should selling continue: that’s the area of the September/October 2024 price action where buyers and sellers seemed equally matched for a few weeks.
That the 50-day moving average is at the nearby $79 level may add to buying interest at that level.
The market cap for Walmart is $705.49 billion. The price-earnings ratio of 38 is about the same as the p/e of the S&P 500. This year’s earnings are up 5.04% and up over the past five years 6.86%.
DZ Bank in early February 2025 upgraded their opinion of the stock from “hold” to “buy” with a price target of $110. Berkshire Hathaway (BRK/A) under Warren Buffett’s guidance owned Walmart for years as a core holding but sold it all in 2017.
The company offers investors a dividend of 1.04%.
Charting the markets!
John Navin
Analyst, The Flash Report
Stats courtesy of FinViz.com. Charts courtesy of Stockcharts.com.
Not investment advice. For educational purposes only.