Tariffs Incoming? Precious Metals Go Higher
As the uncertainty of the effects of the new tariffs becomes greater and as the fear of Elon Musk’s cuts to the U. S. budget is felt, gold and silver stocks may be sought after by investors who aren't usually attracted to the sector.


Vancouver-based precious metals miner, Wheaton Precious Metals (WPM) closed 2.54% lower on Friday after hitting a new 52-week high early in the session.
Many of the better-performing gold stocks had this kind of look which tended to follow the action of the underlying metal. Wheaton is mostly a gold producer but owns and operates enough silver exploration and production that both metals affect the price.
The movement last week took the stock above the October 2024 high and then the Friday selling (following the new high) brought it back down into that range again.
The daily price chart is here.
Daily price chart
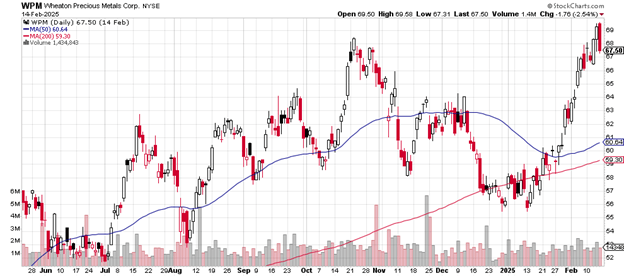
This is a bit wild for a one-day trading range (and looks that way on the hourly chart) but it’s not such unusual volatility for precious metals miners. Sellers moving in at just above old resistance levels does take place now and then.
That the price remains above the 50-day and the 200-day moving averages keeps the chart bullish and that both measures remain in uptrends does as well.
Note how volume contracted on Friday’s selling: 1,434,833 shares traded is less than average daily volume of 1.51 million shares – evidence of less enthusiasm overall as sellers showed up again.
The stock has moved from the late December 2024 low of $55.50 to the present $67.50, a gain from then to now of about 18%, not bad for a couple of months.
The weekly price chart is here.
On this chart, which shows three years of price action, the 50-week moving average has remained above the 200-week moving average, strong evidence of investor satisfaction.
Weekly price chart
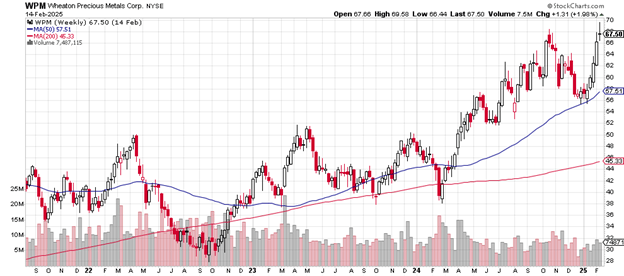
The doji-like candlestick of last week may suggest a pause in the steadiness of the uptrend, especially with that close at just below the October 2024 high. A “doji” candlestick is where the open and close price are pretty much the same – so it looks like a cross.
Should more extensive selling enter the picture, then the first support level is the $55 area (where buyers came in again), and beyond that, there’s the $38 support zone from the October 2023 and February 2024 lows.
As the uncertainty of the effects of the new tariffs becomes greater and as the fear of Elon Musk’s cuts to the U. S. budget is felt, gold and silver stocks like Wheaton may be sought after by investors who aren’t usually attracted to the sector.
The company has a market cap of $30.62 billion. The price-earnings ratio is 50. Earnings this year are up by 23% and up over the past five years by 4.27%.
Wheaton Precious Metals pays a dividend of 0.92%.
Charting the markets!
John Navin
Analyst, The Flash Report
Stats courtesy of FinViz.com. Charts courtesy of Stockcharts.com
Not investment advice. For educational purposes only.