Tesla Stock Crashing, Not Quite Burning...
Given the ferocity of the downward move, how much longer this one will continue to be favored is now subject to question.


Tesla (TSLA) dropped 8.39% Tuesday, taking the price level decisively lower as the usual dip buyers failed to show up and save the day.
Tech stocks, in general, had a bad session. But the Tesla sell-off is one of the biggest among the so-called Mag 7, those big cap favorites in the sector.
Given the ferocity of the downward move, how much longer this one will continue to be favored is now subject to question.
The daily price chart is here.
Notice how a classic head-and-shoulders price pattern has developed with the November 2024 high as the left shoulder, the December 2024 high as the head and the mid-February high as the right shoulder.
Daily price chart
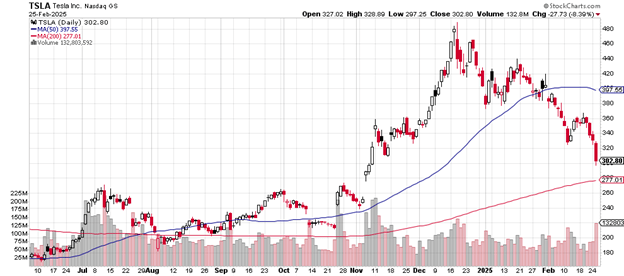
The pattern is confirmed with Tuesday’s low sliding below the earlier-in-February low and below the mid-November dip.
The target for renewed selling might be the early November gap up from the $260 area.
Such a drop would take Tesla to below the level of the 200-day moving average.
It’s clear that the 50-day moving average has turned over and now heads down.
The reddish volume bar along the bottom of the chart shows that today’s action came in with heaviest trading session of the year so far. This type of factor tends to confirm the intensity of the bearishness from those unloading the stock.
Volume was 133,305,545 shares compared to average daily volume of 79.97 million shares.
From $480 in mid-December to Tuesday’s $302.80 is a 37% slide from the peak to the present.
The weekly price chart is here,
Look at how the $302 level corresponds to the July 2023 high which was taken out by the huge upward candlestick of early November 2024. This is the price zone where buyers overcame sellers – and now the sellers are testing it to see how strong of a level it might or might not be.
Weekly price chart
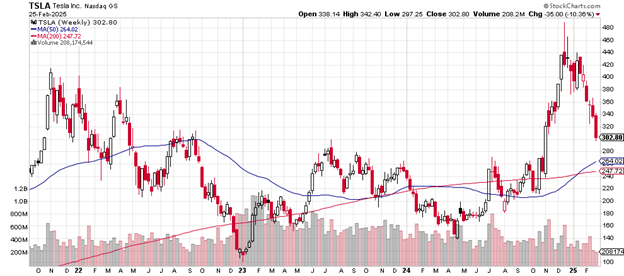
That the 50-week moving average in early January 2025 crossed above the 200-week moving average may be a positive for bulls, longer term.
Note how the volume has steadily decreased from early 2023 levels to the late 2024 levels. Although the price took off higher, fewer and fewer shares traded.
Tesla’s market capitalization is $974 billion. The EV car and truck maker has a price-earnings ratio of 148, way above the S&P 500’s p/e of 38.
Wedbush has an “outperform” rating for the stock as of Jan. 22nd with a price target of $550. Barclays on Jan. 15th rated it “equal weight” with a price target of $325.
Tesla does not pay a dividend.
Charting the markets!
John Navin
Analyst, The Flash Report
Stats courtesy of FinViz.com. Charts courtesy of Stockcharts.com.
Not investment advice. For educational purposes only.