The Best Large-Cap Gold Stock Over the Past Year...
Agnico Eagle Mines (AEM) hit a new 52-week high on Friday. That outperforms most other gold miners this year and with a better percentage gain over the same time than the metal itself.

Agnico Eagle Mines (AEM) hit a new 52-week high on Friday. That outperforms most other gold miners this year and with a better percentage gain over the same time than the metal itself.
The Toronto-based company has a market cap of $46.6 billion. It has exploration, production, and development operations for the yellow metal in Canada, Australia, Finland, and Mexico.
Investors like Agnico Eagle’s +84% earnings this year and its remarkably low debt-to-equity ratio of just .08.
The stock on Friday made the new 52-week high early in the session and then pulled back. Price in mid-January broke out above the late October highs, hesitated to go up further at the $88/$90 level, and took off on Thursday to end the day with a new closing high.
Daily price chart
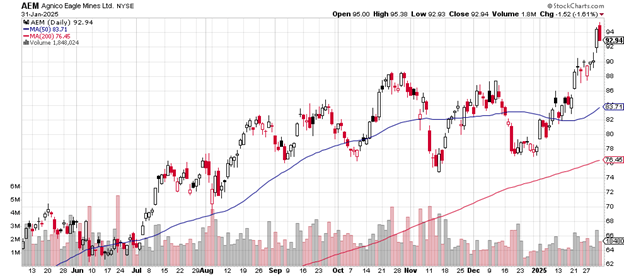
The 50-day moving average (the blue line) is turning upward and the 200-day moving average (the red line) continues to move upward as well, in a steady fashion.
It’s a sign of strength that the price is above both of the moving averages and that both of them are heading higher.
If a pullback occurs, the likely resistance area would be that slight gap up just below $86 or the price where the 50-day moving average sits, now at $83.71.
If a more dramatic sell-off should take place, then the November low of $75 might be resistance (where buyers re-emerge).
Now for the weekly chart. From the January opening price of $51 to the current $92.94 amounts to a 45% gain in one year and one month. That’s better than many of the well-known tech and social media names that trade on the NASDAQ.
Weekly price chart
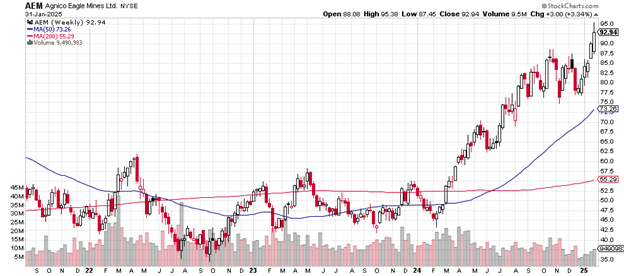
The 50-week moving average crossed above the 200-week moving average in June 2024 signaling the strength about to come.
Agnico Eagle is outperforming Newmont Corp. (NEM) and Barrick Gold (GOLD), neither of which has made it up to new highs on their weekly price charts.
The Newmont weekly chart looks like this:
Weekly price chart
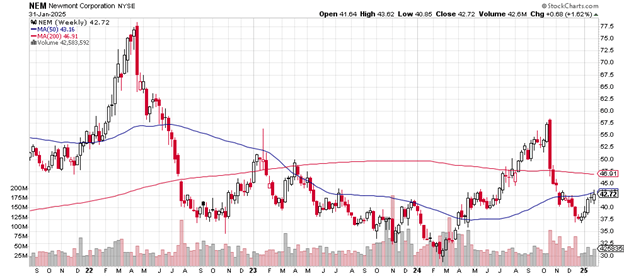
The 50-week moving average has yet to make it above the 200-week moving average. There is no new high.
The Barrick Gold weekly chart is here:
Weekly price chart
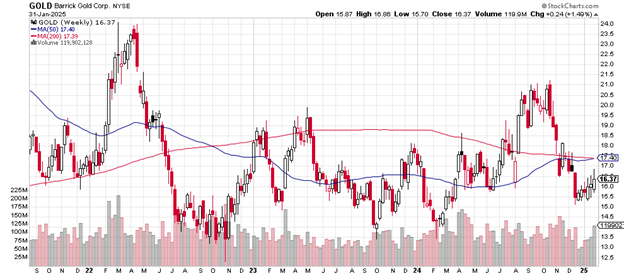
No new high on this one either as the 50-week is about to cross above the 200-week moving average.
I’m posting these two charts of the other NYSE-listed gold mining stocks to demonstrate how remarkable Agnico Eagle Mines's performance over the past year – much better, in fact than these two major competitors.
The short float for the equity is 0.69%, a relatively low figure indicating that the major Wall Street money managers prefer being long by a large margin.
Agnico Eagle Mines pays a 1.55% dividend, not that big but another factor attracting investors.
Charting the markets!
John Navin
Analyst, The Flash Report