The Market's Most Hated Chip Stock...
Wednesday’s low takes the price to below the 200-week moving average, not a great look for a company in the semiconductor industry (or in any industry, for that matter).


Advanced Micro Devices (NASDAQ: AMD) is semiconductor manufacturer. It is underperforming other stocks in that sector and is underperforming the widely followed VanEck Semiconductor ETF.
Advanced Micro Devices, based in Santa Clara, California, is a NASDAQ-100 component and it’s underperforming that index as well.
The tech stock on Wednesday dropped to a new 52-week low as investors seemed to give up on any gains for Advanced Micro Devices, at least for the near term.
The daily price chart looks like this.
The first item to notice is that Wednesday’s volume is huge: it’s visible on the chart as the reddish bar underneath the price candlestick, indicating more selling than on any previous day on the chart to the right. That’s confirmation of the down move.
Daily price chart
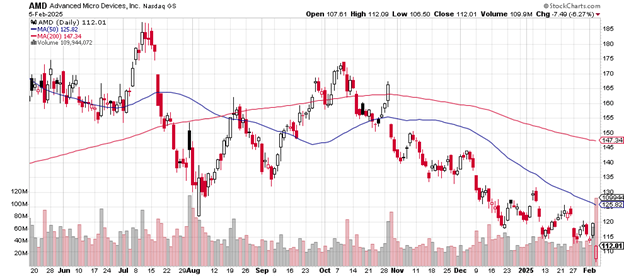
Wednesday’s volume of 110,214,896 greatly exceeds AMD’s average daily volume of 37.71 million.
The 50-day moving average (the blue line) in mid-August crossed below the 200-day moving average (the red line), a signal of the extent of price weakness.
That the price now trades well below both measures is not encouraging for Advanced Micro Devices.
You can see how the 200-day moving average turned over in October 2024 and has headed downward since then.
A change of direction might be indicated if the price could move above the 50-day moving average now at $125.82 and then proceed to above the early January 2025 high of just above $130. Any move upward of less than that would not represent much strength.
The weekly price chart is here.
What a drop from the March 2024 high of $228 to the present $112.91! For those who bought shares at the top and have held on to them, that’s a loss of 50.44%.
Weekly price chart
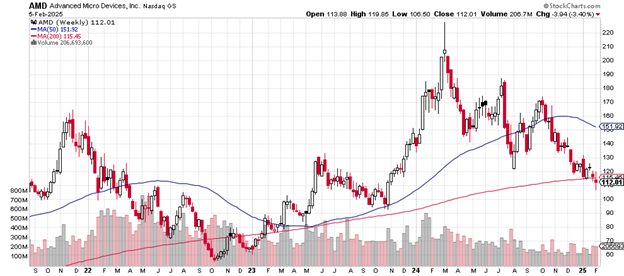
The 50-week moving average in late October/early November 2024 began its descent and it’s been downward ever since then.
Wednesday’s low takes the price to below the 200-week moving average, not a great look for a company in the semiconductor industry (or in any industry, for that matter).
The late October 2023 area is the most likely support area should the selling continue to overcome the buying. That’s the significant previous low on this weekly price chart.
Advanced Micro Devices now has a market cap of $181.77 billion.
The price-earnings ratio is 177, much higher than that of the S&P 500 which has a Shiller p/e of 38.23 and higher than semiconductor maker NVIDIA’s p/e of 49.17.
Analysts at Melius Research in late January had downgraded Advanced Micro from ‘buy’ to ‘hold’ with a price target of $129.
Charting the markets!
John Navin
Analyst, The Flash Report
Not investment advice. For educational purposes only.