The Worst Chip Stock in the Chip Index?
It’s better to close higher than lower, whatever the context. On the other hand, new lows – even those occurring mid-session – generally, are an unhappy development.

Onto Innovation (ONTO), a Massachusetts-based semiconductor equipment and materials stock hit a new low during Friday’s session
It then came back and closed up a lackluster 0.06%.
The VanEck Semiconductor ETF (SMH) was up 1.74%, so Onto Innovation is underperforming that widely followed measure of the entire sector’s performance.
Still, it’s better to close higher than lower, whatever the context. On the other hand, new lows – even those occurring mid-session – generally, are an unhappy development.
Here’s the daily price chart.
This is a pattern with lower highs and lower lows, the very definition of being in a downtrend: The July 2024 high near $240 is the peak and the January 2025 high of near $225 is unable to climb above the July 2024 high…
Daily price chart
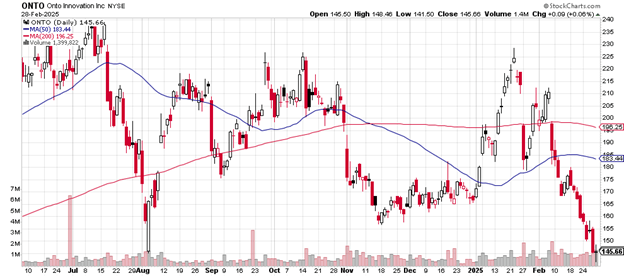
The early August 2024 low $145 was taken out Friday when the price dropped to $141.50 before recovering.
Lower highs and lower lows for at least 9 months adds up to bearishness.
Note that once the mid-January gap down was filled by early November buying, the selling commenced again.
It’s not a bullish sign that the 200-day moving average has now begun to trend downward.
The 50-day moving average in November 2024 crossed below the 200-day moving average and has remained below it since that time.
Friday’s volume for the day of a new low is 1,390,257 shares, which is much greater than its average daily volume of 873,430 shares.
The weekly price chart is here.
Friday’s low price took out the previous monthly low from August 2024, indicating that enough selling was taking place to blast past the spot where buyers had last appeared.
Weekly price chart
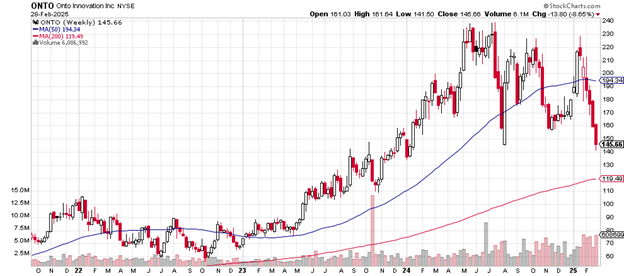
The 50-week moving average now is turning from up to down with four red weekly candlesticks below it.
The next level of support, should more selling take place, is the late October 2023 low near the $110 level. That also happens to be the area for the up trending 200-week moving average. Under that appears to be significant support from early 2023 in the $70 to $80 price range.
Onto Innovation has a market cap of $7.2 billion. The price-earnings ratio is 35.87, more or less in line with that of the S&P 500. The debt-to-equity ratio is a mere .01, a very low figure for a semiconductor company.
The investment firm Cantor Fitzgerald in mid-January initiated analyst coverage of the stock with an “overweight” rating and a price target of $250, a figure more than $100 higher than Friday’s close.
Onto Innovation does not pay a dividend.
Charting the markets!
John Navin
Analyst, The Flash Report
Stats courtesy of FinViz.com. Charts courtesy of Stockcharts.com.
Not investment advice. For educational purposes only.