This One Airline Stock is in Big Trouble...
It would take an extraordinary move, but the October 2022 low of near $27.50 is a support level beyond which is serious trouble.

Delta Airlines (DAL) continued lower and lower with Tuesday’s 7.26% drop, a much greater dip than for the markets as a whole.
The Nasdaq 100 was down 0.28% and the S&P 500 down 0.76%.
Investors are unloading Delta Airlines at a much more intensive rate than most other names of its size and reputation. Some moved the other way today: competitor Southwest Airlines (LUV), for example, was up 8.24%.
Here’s Delta’s daily price chart.
The price has now closed for three days straight below the 200-day moving average, which had been up-trending but now seems to be straightening out.
Daily price chart
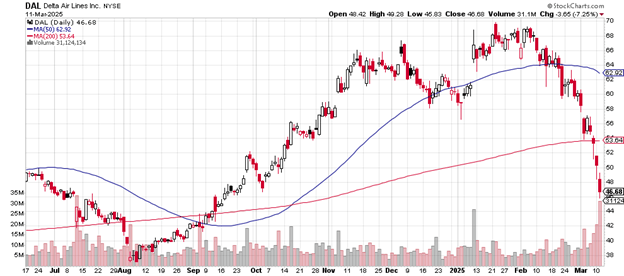
Tuesday’s volume is an extraordinary 31.4 million shares traded, which compares to average daily volume of a mere 8.51 million. That’s more than 3½ times the usual number.
The 50-day moving average is now turning downward – it’s only been since October 2024 that it crossed above the 200-day moving average.
The early January peak was near $70. Tuesday’s closing price was $46.48. From then to now (about two months) comes to a loss in value of 33.6%.
A relative strength indicator (not seen here) has reached its “oversold” level for the first time since the August low. This doesn’t always predict a rally but it’s certainly worth thinking about.
Now that the price has gone below the early October low, the next most likely level for support might be that early August low – if selling continues and intensifies.
Here’s the weekly price chart.
The drop below the 50-week moving average is clear. The price is now below the area of the June/July 2023 high and the May/June 2024 high.
Weekly price chart
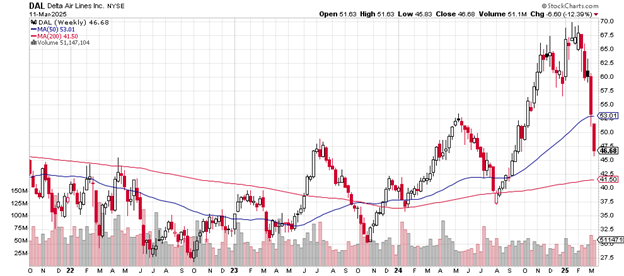
The October 2024 breakout is essentially negated with this week’s candlestick – those buyers appear to have become sellers, not a good sign if you’re a bull.
A possible support level might be the up-trending 200-week moving average now at $41.50. Below that, another likely support area could be the August 2024 low near $32.50.
It would take an extraordinary move, but the October 2022 low of near $27.50 is a support level beyond which is serious trouble.
Delta Airlines has a market cap of $30.15 billion. The stock is an S&P 500 component with a price-earnings ratio of just 8.76. The price-to-book value is 1.97. The debt-to-equity ratio is 1.49.
Goldman on November 15th, 2024 “resumed” their buy rating of the stock with a price target of $83. UBS on November 26th, 2024 “resumed” their buy rating with a price target of $88.
Delta Airlines pays a 1.10% dividend.
Charting the markets!
John Navin
Analyst, The Flash Report
Stats courtesy of FinViz.com. Charts courtesy of Stockcharts.com.
Not investment advice. For educational purposes only.