Trump's Tariff Talk Knocks Down Shoemaker to New Low...
The name-brand footwear maker hit a new 52-week low Wednesday on much heavier than usual volume, indicating the decisiveness of the selling.


Steve Madden (SHOO), the name-brand footwear maker hit a new 52-week low Wednesday on much heavier than usual volume, indicating the decisiveness of the selling.
2,504,500 shares changed hands during the session compared to average daily volume of just 735,000.
Investors may have been hesitant to sell gave up and unloaded their Steve Madden stock. That’s even though management just reported earnings that beat expectations. Concern over the impact of tariffs remains a contributing factor.
The 50-day moving average crossed below the 200-day moving average in mid-January at about the same time as the inauguration of a new U. S. President who favors the implementation of tariffs on a number of industries doing global business.
The daily price chart is here.
Daily price chart
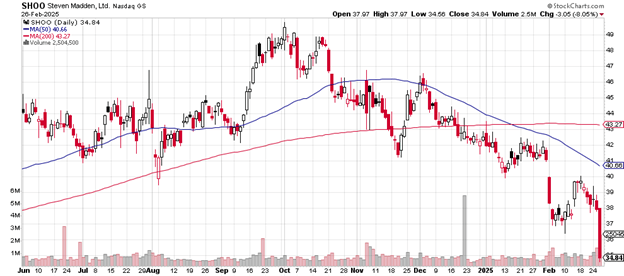
The early February gap down from $41 to $40 may represent the point at which money managers began to fully realize the effects on the shoe and shoe-related sector.
Steve Madden peaked in early October at near $49. Wednesday’s close of $34.84 amounts to a 20.73% drop from then to now.
Here is the weekly price chart.
This is a serious kind of sell-off: the price is now below the 200-week moving average with that Wednesday close. The 50-week moving average peaked in late 2024 and is now beginning to head lower.
Weekly price chart
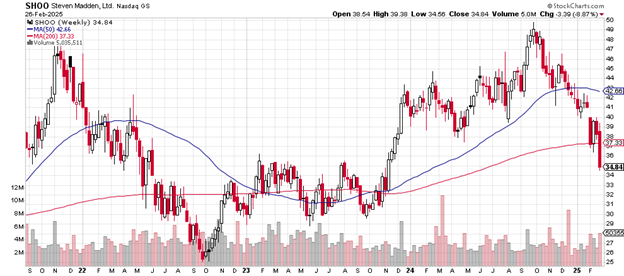
The next likely level of support, should the selling continue, is the $29/$30 area where the stock found buyers at the May 2023 low and at the September 2023 low.
Judging by the intensity of the recent red candlesticks, it’s not out of the question that Steve Madden could re-test that September/October low near $25.
A lot of this price movement is dependent on proposed tariffs and these price charts will reflect investor opinion about how deeply they hurt global footwear names like this one.
The company has a market cap of $2.52 billion and it’s a component of the iShares Russell 2000 ETF (IWM), the widely followed fund that specializes in small caps.
Steve Madden trades with a price-earnings ratio of 14.79 which seems reasonable when compared to the S&P 500’s p/e of 37.55.
The short float of 5.60% is on the high side, indicating the interest in the stock of short-selling funds. It’s not outrageously up there but high enough to take into consideration. Any rally could be fueled by the covering of such shorts.
(The footwear industry is dominated by Nike (NKE) with its market cap of $120 billion and Nike dropped to a new low as well in early February.)
Steve Madden pays a 2.68% dividend.
Charting the markets!
John Navin
Analyst, The Flash Report
Stats courtesy of FinViz.com. Charts courtesy of Stockcharts.com.
Not investment advice. For educational purposes only.