Worrying Sign for One of Detroit's 'Big Three'
GM just reported a net loss for the fourth quarter and says it’s preparing to deal with possible future tariffs.


General Motors (GM) is a brand name, long-time automaker. It is globally known and recognized. Based in Detroit, the company’s market cap is $55.02 billion.
GM just reported a net loss for the fourth quarter and says it’s preparing to deal with possible future tariffs.
The daily price chart shows today’s damage as the -8.89% session takes out the earlier January low before buyers finally come in and perform a partial rescue.
Daily price chart
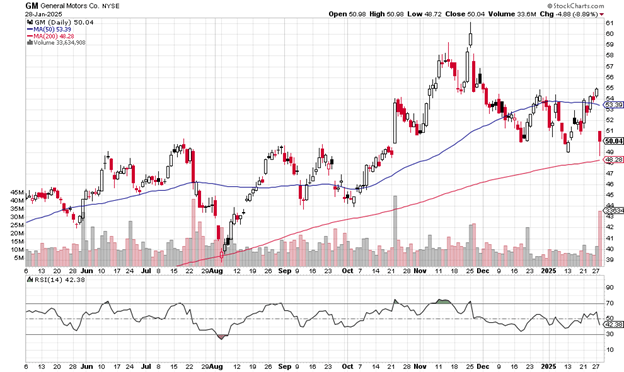
The 50-day moving average (blue line) had already begun trending downward and today’s huge gap down is a close below it. The price almost but not quite tested the 200-day moving average (red line) which has been up trending steadily since the August low.
A close below that would likely trigger the attention of programmatic funds, big hedge funds, and others.
Note that the reddish volume bar, representing more selling than buying. It’s the largest reddish bar since the mid-July trading sessions. This is not a good sign.
The drop from the November peak price of $61 to the current $50 amounts to an 18% slide, a steep decline in a short time for a big name like General Motors.
The weekly price chart shows a 7.18% loss.
Weekly price chart
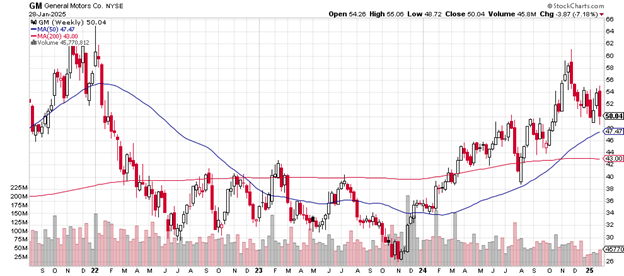
That’s a bearish engulfing candlestick with a higher high than the previous week’s trading range and a lower low than the previous week. That the 50-week moving average in late October 2024 crossed above the 200-week moving average is a positive sign — as long as the stock remains above the 50-day.
The 2024 high of $61 comes in lower than the early 2022 high of $65. General Motors hasn’t made a new high at a time when the S&P 500 and the major tech and social media stocks have done so.
This type of price divergence is another price chart factor that gets noticed by the algorithms and sharp investors. It’s a negative.
The September 2024 low of $44 and the August 2024 low of $39 are likely areas of buying should GM continue to slide.
Some investment houses now think of the auto-maker as a value stock at these levels. The price-earnings ratio of 5.34 is quite a contrast to the Shiller p/e of the S&P 500 which is up there at 38 right now. Also, General Motors trades at a 22% discount to its book value.
Deutsch Bank on January 21, 2025, upgraded their opinion of the stock from ‘hold’ to ‘buy’ with a price target of $60.
I mention these ‘value stock’ factors because buyers who study valuation may be ready to jump in and that will show up on the price charts. It’s impossible to time this but traders should stay aware.
Charting the markets!
John Navin
Analyst, The Flash Report